
Law firm website redesigns - how to get it right
Part 4 of 4 - Five actionable Google Analytics reports to help improve results.
We are assuming you’ve got the basics and you’ve got a simple analytics framework like Goals or Events set-up. If not have a quick glance at this summary article. With these 5 reports you’ll be able to quickly draw actionable marketing ideas to improve your results.
1. Conversion Rates between Mobile & Desktop.
Given mobile internet users are higher than desktop your mobile experience needs to be better than desktop. There’s a report in the Audience section that quickly shows you how your mobile conversions measure up. The numbers below show you where to look.
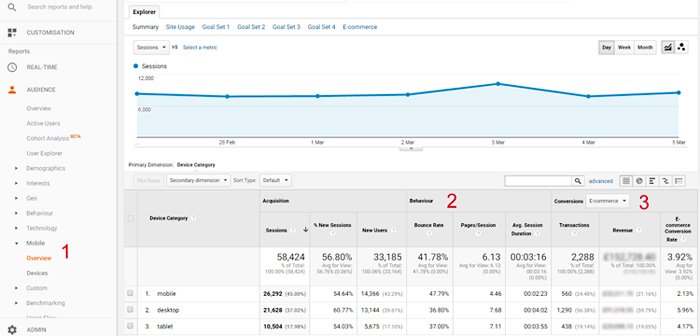
- Step 1 Click on the Audience section and look for Mobile, Overview.
- Step 2 Then look for discrepancies between devices is in the Behaviour section.
- Step 3 Select your primary conversion goal under the Conversions dropdown.
Lower numbers on mobile vs. Desktop is your first clue to a poor mobile experience.
The second, is the conversion rate number of each device. Again, higher is better generally.
2. Identifying How to Improve Paths through Your Site
The way your users move through your website may be different than you expect.
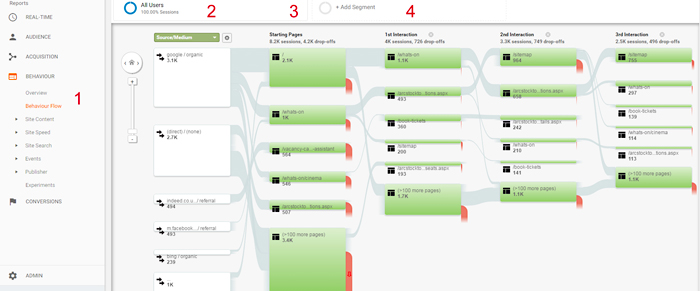
- Step 1. Click on Behaviour and look for the Behaviour Flow section.
- Step 2. Filter your traffic based on the Source/Medium from the dropdown. Google/Organic will be your best bet for finding organic search visitors arriving at your site.
- Step 3. The first section is your Starting pages or landing pages that people are coming to first from Google.
- Step 4. The next interaction is where people are going after leaving the first page of your site.
3. ‘Quick Win’ Pages to Improve for Search
The objective is to find all pages or terms currently ranking on the second page of Google and improve them to get them ranking on the first page.
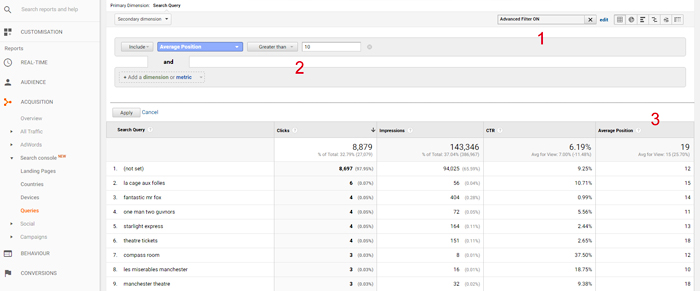
- Step 1. Once you’ve located the Queries report, look for the Advanced Filter. These advanced filters will help you narrow down the results into something a little more actionable.
- Step 2. Sort the data to display all results with an average position of OVER 10. There are 10 results on a search engine result page (SERP), which means the 11th position is the first result on the second page.
- Step 3. Pull down all the results currently ranking high on the second page. This is your ‘Quick Win’ for content + SEO wins.
Improvement suggestions could be the design aesthetic or adding some new production design to liven the page up. It could be adding content and additional context or information to make the page more in-depth. It could even be adding in new media types like videos to help explain or show what the page is talking about.
4. Top Search Pages Leaking Visitors
As we’ve seen so far, visitors don’t always do what we expect them to and they don’t always find what they’re looking for. That’s evidenced by high bounce rates, especially on important pages that are bringing lots of traffic to your site.
Finding those pages that (a) rank highly, (b) bring lots of traffic, but (c) fail to convert them could give you another quick boost of new leads or customers.
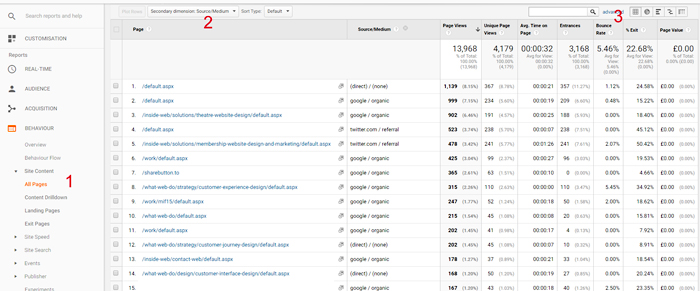
- Step 1. Start by locating your most popular content under Behaviour, Site Content, All Pages.
- Step 2. Click on Secondary Dimension, which we’ll use to again filter Source/Medium.
- Step 3. Typically Google Analytics will automatically show the most popular pages.
Cross reference the popular search pages, picking out the ones with high Bounce rates.
It’s common for blog posts to have bounce rates as high as 60-70%, however anything over that should be cause for concern. General website pages have lower bounce rate ranges of anywhere from 30-40%.
You might consider finding out why people are bouncing. Try using some qualitative methods like live chat, or other survey pop-ups in your marketing stack to get quick feedback on what people what to find when they hit this page.
5. Top Converting Content to Improve Internal Linking
Following the last few steps will help you identify the most popular way people are (a) arriving at your site and (b) navigating through it.
Executing those steps will help you capitalise on bringing in more site visitors while also shoring up holes or leaks causing people to leave too early because they’re frustrated or can’t find what they wanted.
The next logical step is to effectively funnel these people into your primary website goals or objectives to move your business metrics (like leads and customers).
Fortunately, there’s a simple report that can help you connect these dots.
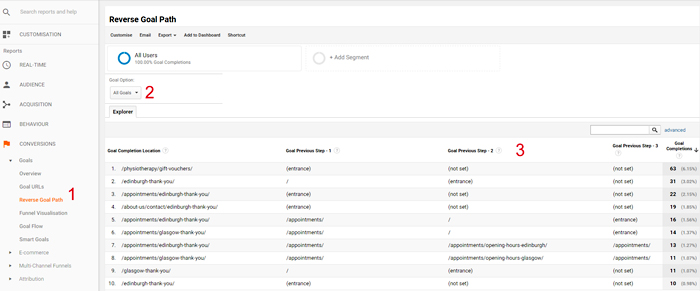
- Step 1. Located the Reverse Goal Path under the Conversions section of Google Analytics.
- Step 2. Select the primary Goal you’d like to view or analyse.
- Step 3. Now you’ll be able to see the previous pages people used before accomplishing this Goal on your site. That means the page or two just PRIOR to converting.
These are your highest converting (or assisting) pages that you should funnel the rest of your visitors to from the other popular pages that you’ve discovered so far.