Overview.
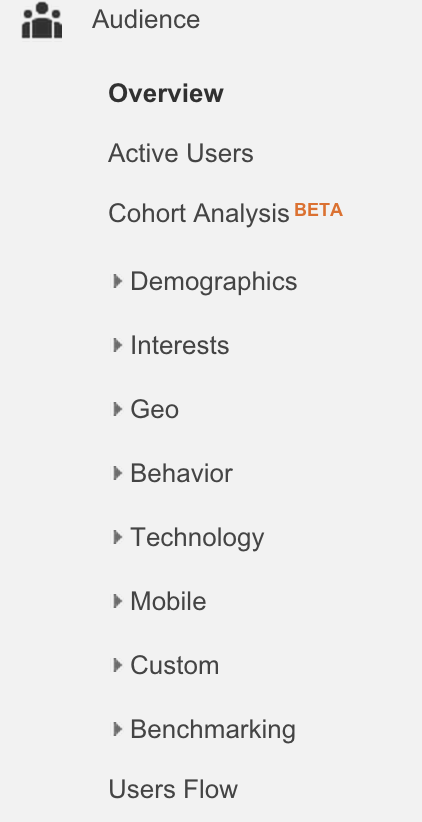
Google Analytics is broken down into eight main sections;
- Dashboards
- Shortcuts
- Intelligence Events
- Real-Time
- Audience
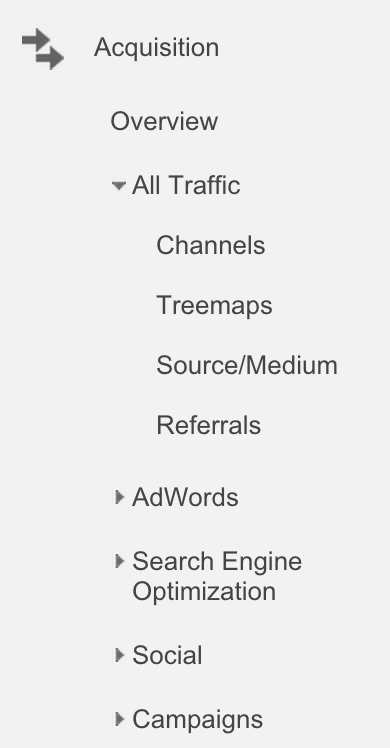
- Acquisition
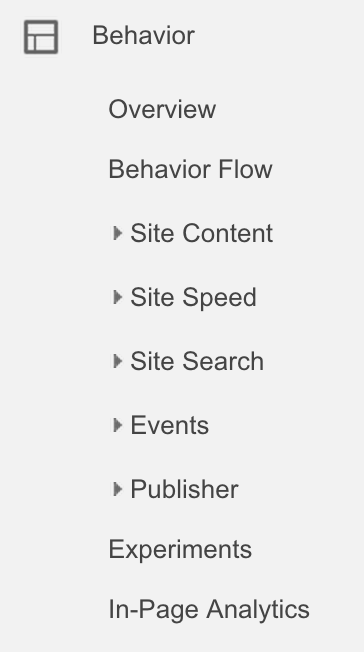
- Behaviour
- Conversions.
Almost all eight sections contain sub-sections that provide a more data. Before we look further in to the sections that matter most, here are some basic Google Analytics terminology:
- Users: These are people who have visited at least once within your selected date range, and includes both new and returning.
- Dimensions: These are descriptive characteristics of an object. For example, browser, exit page and session duration are all considered dimensions.
- Metrics: These are individual statistics of a dimension, such as Average Session Duration or Screen views.
- Bounce Rate: This is the percentage of single-page visits, meaning that someone left your site from the same page at which they entered; aka, they didn’t interact with your site.
- Sessions: A session is the period of time that a user is actively engaged with your website.
Let’s now look into the areas that you want to pay most attention to.
Looking at what matters most.
There are three sections that matter most to marketers: Acquisition, Audience and Behaviour.

The Audience section provides multiple subsections that display information about the gender, age and location of your website visitors.
The Acquisition section will provide detailed information about how people arrive to your site.

The Behaviour section helps you understand how people are interacting with your site.

Analysing these sections will provide you with insight that will enable you to make marketing decisions about the type, tone, and placement of content that you use on your website.
Traffic Channels
Before we dive into who exactly is visiting your site, it’s important to understand how they’re getting there.
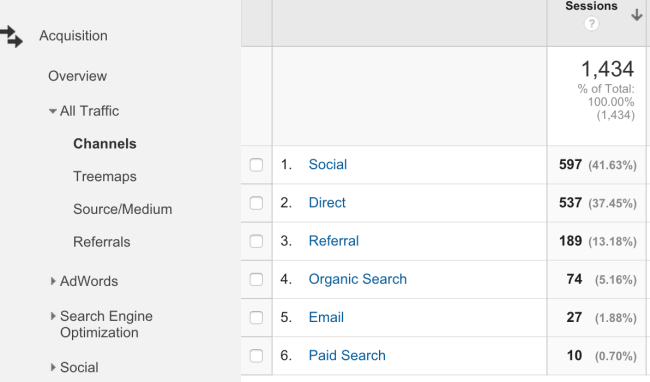
To see your various traffic sources for a set period of time, go to the Acquisition tab and click the “All Traffic” dropdown. Select the “Channels” button, set the time period at the top of the viewing pane and scroll down to see the results for the give timeframe.

Here’s a simple breakdown of what these channels are about:
- Direct: Visitors that came directly to your website. They either typed your URL right into their browser, clicked on a bookmark or clicked a link in an email. Direct traffic is a strong indicator of the strength of your brand.
- Organic Search: You can thank search engines like Google and Bing for these website visitors. An organic visitor is someone who got to your website by clicking on a link from a search engine results page. A lot of organic traffic is a strong indicator of the value of your content and SEO strategy.
- Paid Search: You’ll find any paid search like Google AdWords campaigns in this viewing pane.
- Referral: This represents visitors that clicked a link on another site to land on your website. A lot of referral traffic means that you’re being talked about (and linked to) from multiple other websites.
- Social: shows you exactly what social media channels drive traffic to your site.
- Email: The number of visitors that came to your website from an email campaign.